How to Implement Stoplight Reports for Decision Making – Tracking Key Business Metrics
· 3 min read · Systems quadrant

Why Stoplight Reports Are Essential for Business Success
Many businesses struggle with unclear reporting, slow decision-making, and lack of accountability.
Without a clear performance tracking system, companies face:
❌ Missed warning signs that lead to bigger problems
❌ Confusion about which priorities need immediate action
❌ Leaders making decisions based on guesswork instead of data
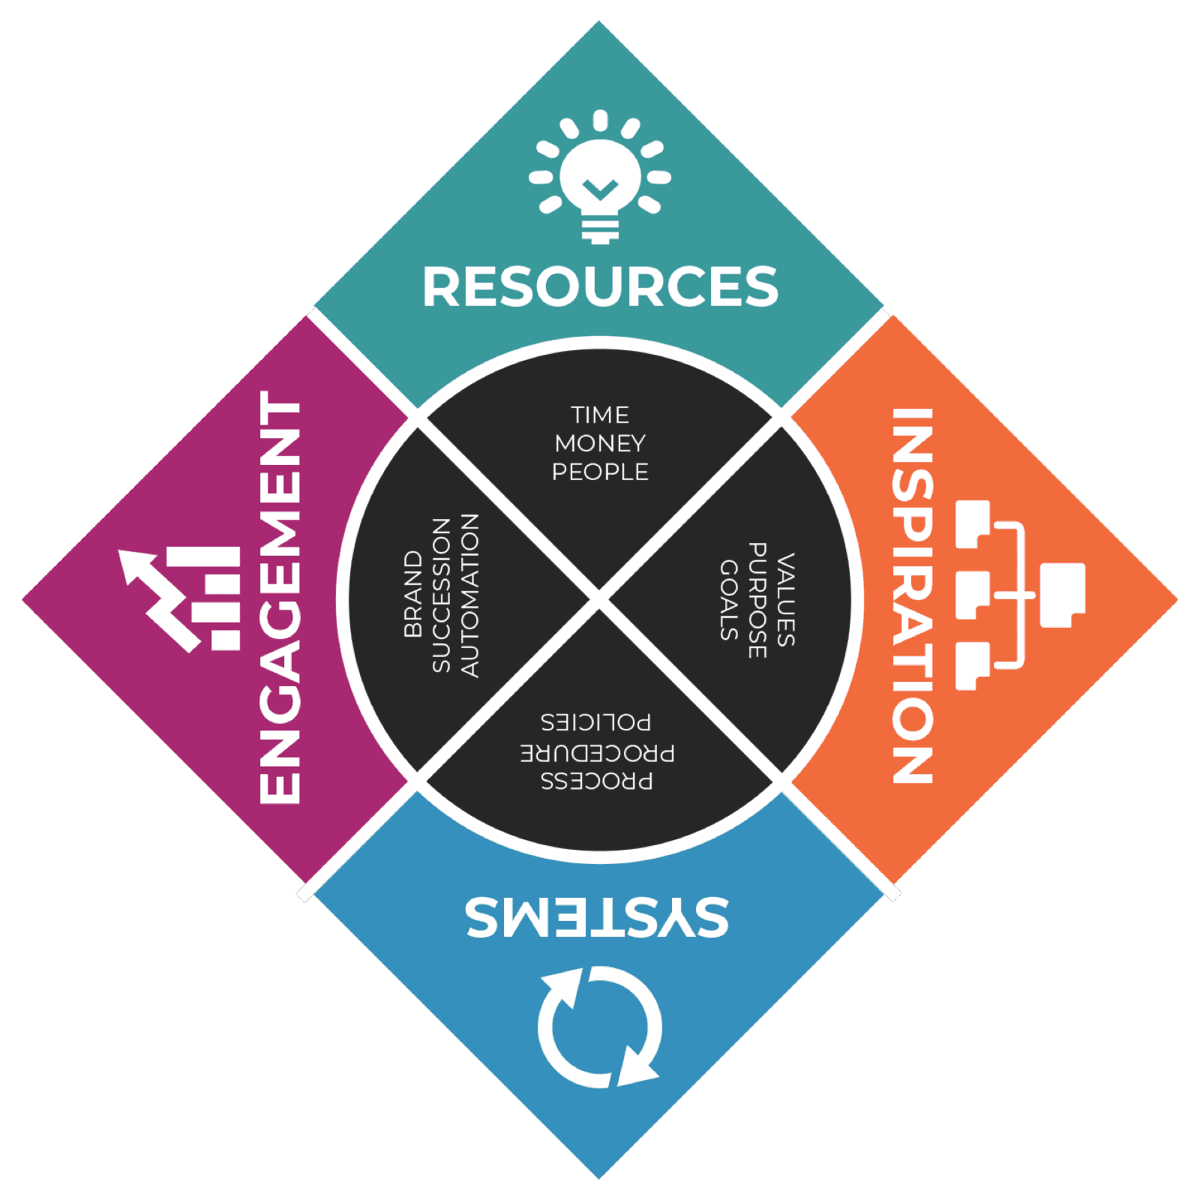
The RISE Business Framework teaches that Stoplight Reports provide a simple, visual way to track key metrics and drive better decision-making.
If your business isn’t using real-time performance tracking, you might be reacting to issues too late instead of proactively solving them.
What is a Stoplight Report?
A Stoplight Report is a performance tracking tool that uses color coding to show the status of key business metrics:
🟢 Green – Everything is on track, no action needed.
🟡 Yellow – Caution, potential issue developing.
🔴 Red – Critical problem that needs immediate attention.
📌 Example: A company tracking monthly revenue goals might see:
- 🟢 Green if revenue is at or above target
- 🟡 Yellow if revenue is slightly behind goal
- 🔴 Red if revenue is significantly below target and action is required
This simple system helps leadership quickly assess what’s working and where to focus attention.
Why Businesses Struggle Without Stoplight Reports
Many companies fail to make data-driven decisions because they:
🚫 Don’t have a structured reporting process
🚫 Manually review too much complex data without clear takeaways
🚫 Lack visibility into business performance at a glance
Without Stoplight Reports, businesses experience:
❌ Slow reaction times to emerging problems
❌ Inefficient meetings spent analyzing data instead of solving issues
❌ Difficulty aligning leadership teams on priorities
How to Implement Stoplight Reports in Your Business
The RISE Business Framework provides a structured approach to performance tracking.
Step 1: Identify Key Business Metrics
✔ Choose 5-10 critical KPIs to track weekly or monthly.
✔ Ensure each metric directly impacts business goals.
📌 Example: A sales team might track:
- Lead conversion rates
- Revenue growth
- Customer churn rate
Step 2: Define Color-Coded Thresholds
✔ Set clear benchmarks for Green, Yellow, and Red status.
✔ Ensure every team understands what each color means.
📌 Example:
Customer Satisfaction Score (CSAT)
🟢 Green: 90%+ satisfied customers
🟡 Yellow: 80–89% satisfaction (needs improvement)
🔴 Red: Below 80% (urgent action required)
Step 3: Automate Data Collection & Reporting
✔ Use spreadsheets, dashboards, or business intelligence tools.
✔ Ensure reports are automatically updated for accuracy.
📌 Example: A company using Google Sheets or Power BI can automate Stoplight Reports to update in real time.
Step 4: Review & Take Action in Weekly Meetings
✔ Discuss Yellow & Red areas in team check-ins.
✔ Assign clear action steps to resolve issues.
📌 Example: If customer churn is in the Red zone, leadership may adjust pricing, improve service, or launch retention campaigns.
Frequently Asked Questions (FAQs)
FAQs About Stoplight Reports & Business Metrics
1. How do Stoplight Reports improve decision-making?
✔ They highlight urgent issues without overwhelming leaders with data.
✔ They ensure teams focus on fixing problems, not just reviewing numbers.
2. What’s the biggest mistake companies make with Stoplight Reports?
✔ Setting unclear thresholds, leading to confusion about when action is needed.
3. How often should businesses update their Stoplight Reports?
✔ Weekly or monthly, depending on the business needs.
FAQs About the RISE Business Framework
1. How does RISE help businesses implement structured reporting?
RISE provides performance tracking tools, reporting templates, and KPI monitoring systems.
2. Can small businesses benefit from Stoplight Reports?
Yes! Small teams need quick insights even more, since every decision has a greater impact on business success.
3. How do I start using Stoplight Reports in my business?
- Take the RISE Business Assessment
- Identify key metrics to track
- Implement Stoplight Reports in team meetings
Final Thoughts
Stoplight Reports provide a fast, clear way to track performance and make better business decisions.
By implementing color-coded KPI tracking, businesses can:
✅ Spot problems before they escalate
✅ Align leadership on key priorities
✅ Drive data-based decisions that improve efficiency
🚀 Want to improve decision-making? Start using Stoplight Reports today!